Mapping / Geocoding
This function is created to obtain Census Division Information (CSDUID) by mapping each construction project on a shape file. The raw data had to be converted into geographic coordinates first before mapping onto the shapefile.
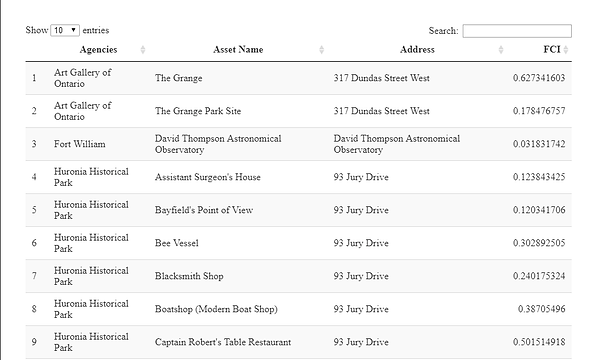
### Data Table dispalying records without latitude and longitude
```{r table, echo=TRUE, warning=FALSE, message=FALSE}
df2 <- df2 %>% filter(`Lat/Long`=="Missing") %>%
select(`Agency - Agency Name`,`Asset - Asset Name`,
`Asset - Address 1`,`Asset - FCI (3 Year Window)`)
datatable(df2,editable='cell',colnames=c("Agencies","Asset Name","Address","FCI"))
```
Raw data
Running the raw data through Google Geocoding API to obtain latitude and longitude. The code on the right also fixes some invalid output generated - NA fields are populated manually.
#Assets with empty latitude ang longitude that was excluded earlier in the geocoding process
failed_GID1 <- results%>%
filter(is.na(Longitude) & is.na(City) & is.na(Address1)& is.na(Final.Long))
building.latlong <- results %>%
filter(!is.na(Final.Lat) & AssetType == 'Building')%>%
dplyr::select(Grouping, Asset_Loc_Name, Final.Lat, Final.Long)
fix.site.latlong <- results %>%
filter(results$Asset_Id %in% failed_GID1$Asset_Id & AssetType == 'Site')%>%
dplyr::select(-Final.Lat, -Final.Long)%>%
inner_join(building.latlong, by = c("Grouping" = "Grouping", "Asset_Loc_Name" = "Asset_Loc_Name" ))
Fort.Erie.latlong <- results %>%
filter(Grouping == "Niagara Parks Commission" & City == "Fort Erie" & grepl("Historic Fort Erie",AssetName))%>%
dplyr::select(Latitude, Longitude)
fix.building.latlong <- results %>%
filter(results$Asset_Id %in% failed_GID1$Asset_Id & AssetType != 'Site')%>%
mutate(Final.Lat = Fort.Erie.latlong$Latitude)%>%
mutate(Final.Long = Fort.Erie.latlong$Longitude)
geocode_success <- results%>%
filter(!is.na(Final.Long))
final <- union_all(union_all(geocode_success,fix.site.latlong),fix.building.latlong)
```
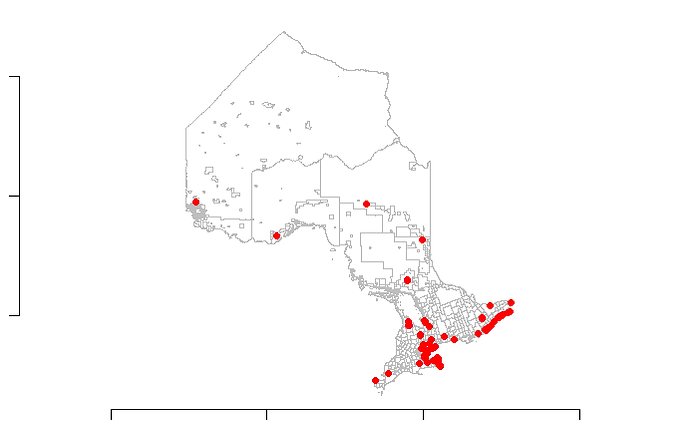
Mapping Lat/Longs from the previous step onto the shapefile to obtain CSDUID. The code also fixes outliers by mapping them on to the nearest point of the map. Validations were made to ensure proximity mapping works as intended.
The shapefile is truncated so the loading time is reduced for slower computers. This function is also compatible with all other agency data.
Mapping latitude and longitude onto Shapefiles and obtain census division information (CSDUID). Results attached below.
```{r GIS Mapping, echo=TRUE, warning=FALSE, message=FALSE}
AssignGIDs <- function(Longitude, Latitude) {
ontario <- readOGR("./input/Shape Files/map.shp")
coords = data.frame(cbind(Longitude,Latitude))
names(coords)<- c("long","lat")
coordinates(coords) <- ~long+lat
coords@proj4string <- ontario@proj4string
#Assigning GIDs | Left Join to include all.
fix <- data.frame(st_join(st_as_sf(coords),left=TRUE,st_as_sf(ontario),join=st_intersects)) %>% select(-geometry)
#Requires geos 3.6.1 on server, having issues installing.
# fix <- data.frame(st_join(st_as_sf(coords),left=FALSE,st_as_sf(ontario),join=st_nearest_feature)) %>%
select(-geometry)
#Using HidePlots global variable to skip generating plots when building GUT.
if(!exists("HidePlots")) {
#to address 'figure margins too large' errors
par(mar=c(1,1,1,1))
map <- plot(ontario, border = "grey")
axis(1)
axis(2)
points(coords, col = "red", pch=19)
}
return(fix)}
```