2021 Tokyo Olympics data analysis
- Steve Kan

- Sep 15, 2021
- 1 min read
Updated: Sep 23, 2021
The following data analysis is conducted using 2021 Tokyo Olympics datasets posted on Kaggle by Arjun Prasad Sarkhel. This analysis provide insights into the Olympics that most don't know about.

# Packages
import pandas as pd
import numpy as np
import matplotlib.pyplot  as plt
import openpyxl
import xlrd
from textwrap import wrap
import os

# Reading data
path = "C:/Users/Stevie/Desktop/Coding/data/"

#List all files in the directory
medals = pd.read_excel(path+"Medals.xlsx",engine="openpyxl")
Athletes = pd.read_excel(path+"Athletes.xlsx",engine="openpyxl")
Coaches = pd.read_excel(path+"Coaches.xlsx",engine="openpyxl")
Teams = pd.read_excel(path+"Teams.xlsx",engine="openpyxl")
EntriesGender = pd.read_excel(path+"EntriesGender.xlsx",engine="openpyxl")
Studying the number of Olympics Medals obtained by top-10 countries:
df = medals.loc[medals["Rank"] <= 10]
df = df[["Team/NOC","Gold","Silver","Bronze"]]
countries = df1.iloc[:,0]
indx = np.arange(len(df))
df1.plot(kind='barh',stacked=True,figsize=(14,6))
countries = ['\n'.join(wrap(country,20)) for country in countries]
plt.yticks(indx,countries)
plt.xlabel("Number of Medals")
plt.ylabel("Countries")
plt.title("Number of Olympics Medals obtained by the Top-10 Countries")
plt.show()
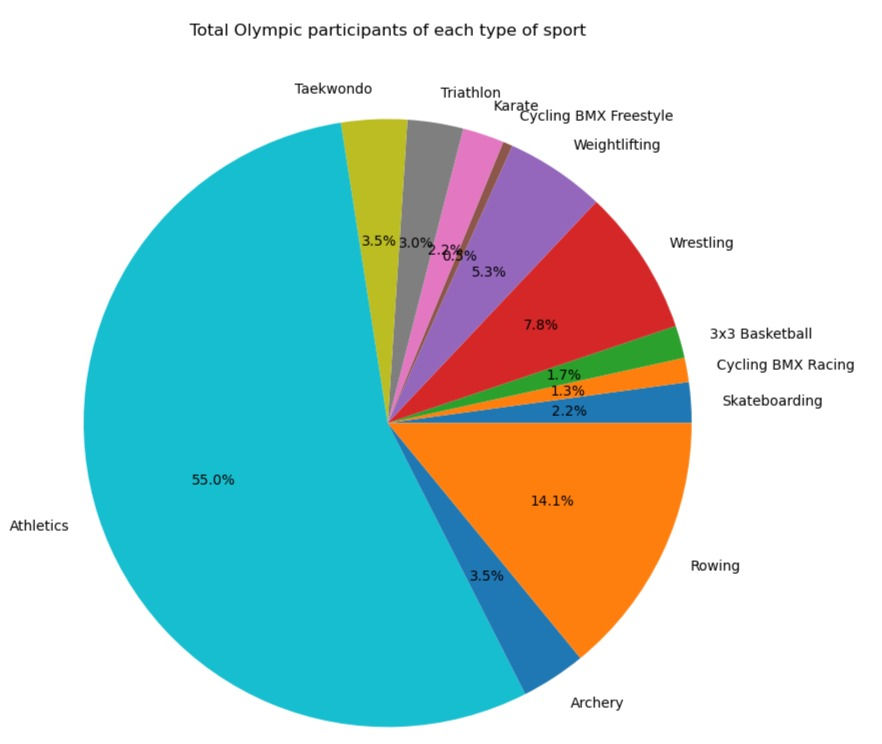
# Total Olympic participants of each type of sport - 25% of the originally data
EntriesGender1 = EntriesGender.sample(frac=.25)
names = EntriesGender1["Discipline"].dropna()
values = EntriesGender1["Total"].dropna()
plt.figure(figsize=(14,6))
plt.pie(x=values,
labels=names,
autopct='%.1f%%',)
plt.title("Total Olympic participants of each type of sport")
plt.show()
EntriesGender.plot(kind="pie",label=label_p,figsize=(14,6))
Female vs Male participants of each disipline:
df2 = EntriesGender[["Discipline","Female","Male","Total"]]
df2.sort_values("Total",inplace=True)
df2 = df2[["Discipline","Female","Male"]]
indx2 = np.arange(len(df2))
dis_name = df2.iloc[:,0]

df2.plot(kind="barh",stacked=True,figsize=(14,14)) #plotting
plt.yticks(indx2,dis_name)
plt.xlabel("Number of people")
plt.ylabel("Discipline")
plt.title("Male/Female participants of each discipline")
plt.show()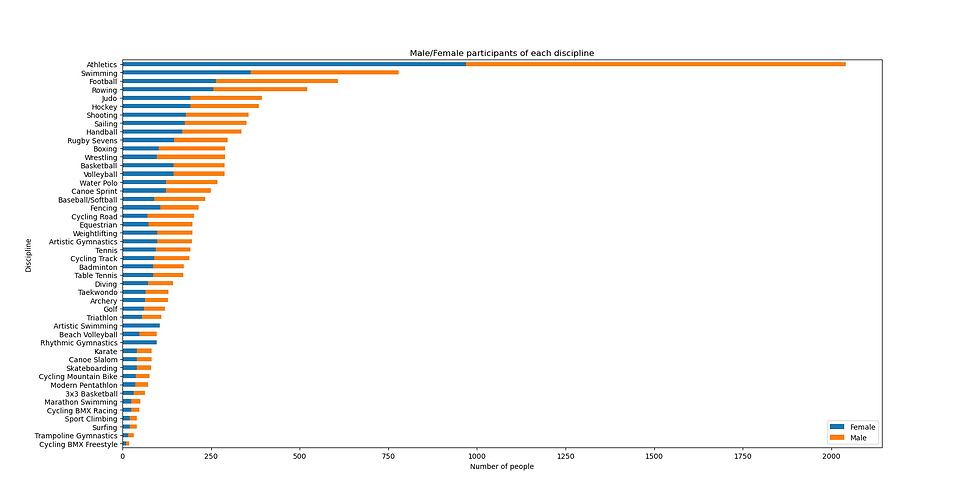
Total number of participants of each discipline - 25% of the data
EntriesGender1 = EntriesGender.sample(frac=.25) #25%
names = EntriesGender1["Discipline"].dropna()
values = EntriesGender1["Total"].dropna()

plt.figure(figsize=(14,6))
plt.pie(x=values,
        labels=names,
        autopct='%.1f%%',)
plt.title("Total Olympic participants of each type of sport")
plt.show()

EntriesGender.plot(kind="pie",label=label_p,figsize=(14,6))
- WORK IN PROGRESS


Comments